Have you asked yourself: How should we think about operational improvements in our organization, given that there are so many moving parts? Over the next 3 weeks I’ll be looking at how to capture and assess data, implement operational improvements to help your project succeed and, perhaps most importantly, I’ll wrap up with how to engage your internal stakeholders to keep your project on track.
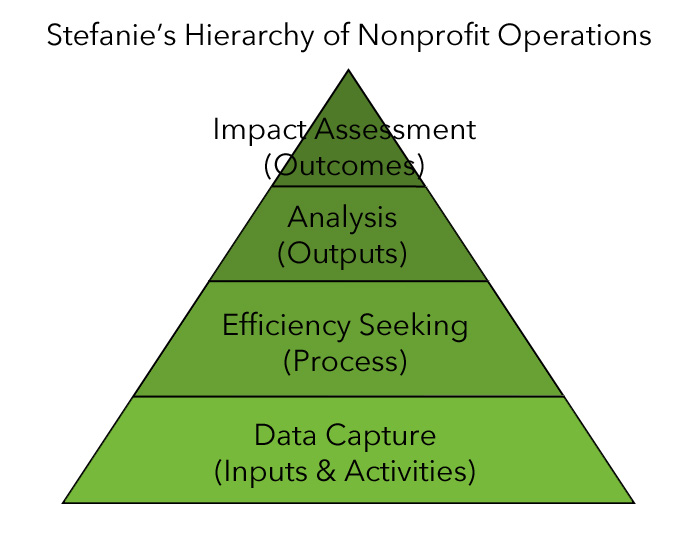
My colleague Stefanie Archer came up with the Hierarchy of Nonprofit Operations as a result of our work with a wide range of NPOs. Riffing on Maslow’s Hierarchy, Stefanie’s Hierarchy argues that nonprofits – indeed, all organizations – go through the same progression with their operational practices. This post presents three different ways to read this model and interpret it when considering any systems improvement activity.
I like to use the terminology that is standard for the construction of logic models, so that it’s clearer which part of the operations in program delivery corresponds to which part of the logic model. This is my own, and a loose correlation. Use it or discard it as you need.

1. The Foundational-to-Aspirational (Bottom Up) Way To Read the Model
The most basic level is the recognition of the need for data capture. This could be on paper, in spreadsheets, or in a database, but at some point in every organization’s life it identifies a need for data capture in its work processes. Usually this starts with financial data, and, over time, progresses to anything identified as important to the organization.
At some point, the data grows beyond a human ability to both capture and make meaning from it. This tends to spur efficiency seeking. Can we aggregate the data in ways that help us make sense of it? Can we capture it in less time consuming ways so that we have more brainpower to devote to it?
When data is being captured and used efficiently, the door is opened for analysis. This is a hindsight activity and is largely quantitative in nature. It answers how many and how much, and done well, it can also answer basic change-over-time questions. How many participants did we have last month compared to this month? This is largely used as a middle management tool to assess the current health of the organization.
With enough data to perform analysis, leadership can begin to ask predictive, proactive questions about impact. Does the data we’ve gathered provide proof that we are having the impact we believe we’re having? Are our activities and efforts in alignment with our theory of change / logic model?

2. The Aspirational-to-Foundational (Top Down / Alignment) Way to Read the Model
We begin with our impact, or the outcomes our organization has as its mission to achieve. Our impact is specific and measurable. We say we will reduce recidivism in released prisoners by N%. We say we will improve literacy in immigrant populations from X% to Y%. These set the goals for all of our operations, further down the pyramid.
The analysis is of each intervention’s outputs to assess if we are meeting the targets that support our overall impact. To assess if we are reducing recidivism, we may have several target goals (within the first 6 months, 6 months to 1 year, 1 – 3 years, etc). We may want “how many / how much” measurements of program participants that stayed out of jail, as well as other indicators such as probation meetings, program participation, job seeking, and so on in alignment with our logic model.
In the top-down model, the lower two tiers get into a tight feedback loop. We have limited staff to deliver programs, and the data they capture (generated by activities) must be captured in sufficient detail to support the analysis and impact measurement. Typically, a small staff and high data capture demand means that pressures from above and below will drive efficiency seeking in data capture (not in activity or program delivery).
3. The Feedback Loop Way To Read The Model
Real life isn’t as tidy as either of the preceding interpretations, although both are perfectly valid approaches to considering the improvement of any activity or program delivery. They key, of course, is that they’re done in alignment, with the data capture being made efficient toward analysis and impact that all support and reinforce one another. It seems obvious, but we often see, particularly in mature organizations, data capture that is out of alignment with analysis needs, or outcomes, and efficiency initiatives undertaken out of alignment with all of these.
In our ideal world, each level in the hierarchy informs and reinforces the other. We represent this feedback loop in the image below, because a change at one level often necessitates a change in its neighboring level.

The data capture informs the efficiency seeking, but efficiency seeking may uncover data capture that is or is not being done. Analysis and reporting needs may uncover data capture that is or is not being done, driving a new efficiency need. The ability to capture day may inform the ability to measure an organization’s goals – some things are simply easier than others to quantify.
Summary:
This model puts a visual way of thinking around what it takes to operationalize any one program within an organization’s theory of change. The reality is that each activity within a theory of change likely has its own process and outputs, at a minimum; so an organization with five programs would engage with this process in five different, probably overlapping ways.
Stefanie’s Hierarchy isn’t limited to program data. This is relevant for basic financial information, compliance information, HR data – essentially, any data that humans have to interact with for a specified reason within your organization.
At 501Partners, we use this model to help us clarify the type and nature of our engagement with a client. We do the majority of our work in the Efficiency level, touching on data capture and analysis.
Now that we have a framework, next week we will discuss how to make sure your project succeeds with operational and technical improvements.
