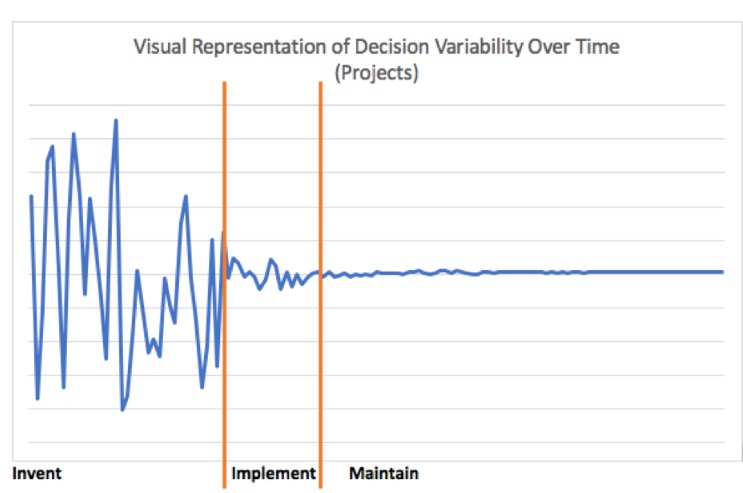
In our previous post, we introduced the idea of the organizational capacity model and the graph of decision variability over time that helps illustrate the idea. In this post, we take the same graph but break it down differently, to reflect a project’s lifecycle.
The first takeaway in this series is that knowing your current organizational capacity can help you align the type of Salesforce projects you pursue for optimal success. You can read about that in more detail here.
Takeaway Two: Your technology enforces your organization’s business processes, which puts a burden on your organization at the same time it offers efficiency gains.


Recent Comments